
Measurements with the oscilloscope

Figure 1: 8LO4I cathode-ray tube of an older one oscilloscope

Measurements with the oscilloscope
As the name suggests, an oscilloscope is used to make (electrical) oscillations visible.
Devices of the older generation used a cathode ray tube for this purpose. In this tube, an electron beam was deflected and hit a luminescent screen (luminescence: absorption of energy in matter with subsequent re-emission in the visible spectral range). In the cathode ray oscilloscope, the kinetic energy of the electrons is converted into mostly greenish light. This deflection could be done with both electric and magnetic fields. In the cathode ray oscilloscope, the electron beam is deflected as a function of the measurement signal, its intensity remains constant.
Figure 2: Modern four-channel oscilloscope with a flat-panel display
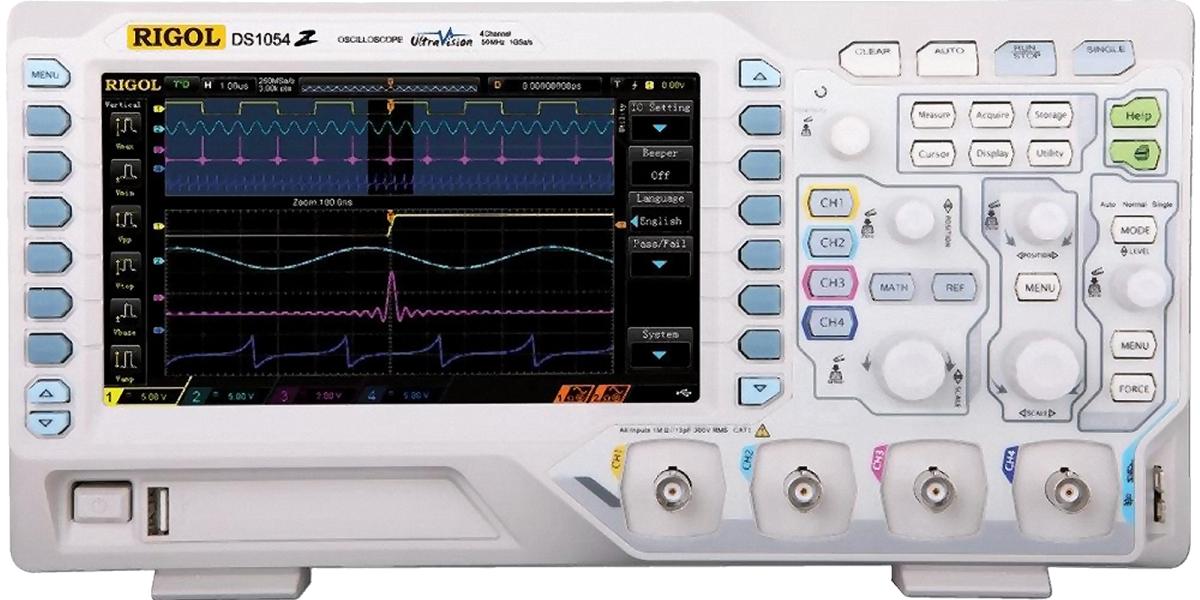
More modern oscilloscopes use a flat-screen, similar to a computer. A processor also operates in the device, which generates a vivid image from the measurement signal. Its functions are determined by the software used in the device. This also makes these modern oscilloscopes more versatile.
Almost every oscilloscope offers the following two operating modes:
Normal operation

Figure 3: Oscilloscope in normal operation
In this operating mode, the electron beam travels evenly from left to right. The duration of one pass can be set from a few microseconds to seconds. The vertical position of the beam is controlled by the signal to be examined: the position on the screen is directly proportional to the instantaneous value of the input voltage. The proportionality factor, i.e. the voltage range displayed on the screen, can be adjusted in the range millivolts to volts. The resulting image on the screen is a time representation of the input voltage (time-voltage diagram).
If the measurement signal is periodic (e.g. sinusoidal or a pulse train), it can be synchronized with the horizontal movement of the electron beam.
For this purpose, the beam is allowed to wait at the left end of the screen until a trigger signal occurs. With internal triggering, the trigger signal is generated by comparing the measuring voltage with the trigger level, a constant, adjustable voltage: if the sign of their difference changes from - to + (or vice versa, depending on the setting), the triggering occurs. Here, minus and plus correspond to a certain voltage (e.g. 0 volts and 5 volts). It is irrelevant if a trigger signal occurs several times during one pass. If, on the other hand, a trigger signal is triggered several times within a period, a phase-shifted superimposition occurs. As an alternative to internal triggering, the trigger signal can also be supplied from outside, this is called external triggering.
X-Y operation

Figure 4: Lissajous figure
X-Y mode is a very interesting application, although it has completely lost its importance in practical measurements.
In X-Y mode, the beam is controlled in both the X direction (horizontal) and the Y direction by a separate measurement signal. This makes it possible to display one signal as a function of another signal (for example, a current-voltage diagram). The display range can again be adjusted independently in both directions. Triggering is not required in this mode.
If two sinusoidal voltages are applied to the X and Y inputs, a so-called Lissajous figure is produced. If both sinusoidal voltages have exactly the same frequency, only a straight diagonal line is drawn on the screen. If there are phase differences between the two sinusoidal voltages of the same frequency, an ellipse or even a circle is produced. If the frequencies differ, a figure similar to the one shown in Figure 4 is produced.
At a time when spectrum analyzers and frequency counters
did not yet exist, this was, for example, one method of comparing frequencies. Today, phase measurements are better performed with vector network analyzers (VNA).