
Unwanted Signals on the Radar Display: Radar Clutter

Figure 1: A radar receives echoes from all objects within its antenna radiation pattern, including unwanted objects.

Figure 1: A radar receives echoes from all objects within its antenna radiation pattern, including unwanted objects.
Unwanted Signals on the Radar Display: Radar Clutter
Clutter refers to unwanted echo signals received and displayed by a radar because they reduce the probability of detection of the intended targets.
- Echoes known as ground clutter originate from stationary objects such as buildings, trees, hills, and similar features.
- Sea clutter consists of echoes reflected from waves on the sea surface. Wind causes these waves to move with a radial velocity, producing a Doppler frequency in the returned echoes. This makes sea clutter particularly difficult to suppress.
- Weather clutter occurs when clouds, rain, snow, or fog are detected and displayed by the radar as targets.

Figure 2: A PPI display showing radar echoes and clutter from stationary targets

Figure 2: A PPI display showing radar echoes and clutter from stationary targets
Sophisticated signal processing methods, some of which make use of the Doppler effect, reduce the harmful effects of clutter. These methods are known as Moving Target Indication (MTI). They exploit differences between the echoes of successive transmitted pulses, for example through inter-pulse cancellation.


- Methods that do not use the Doppler effect
- Doppler-based methods
- Other methods
Sea Clutter
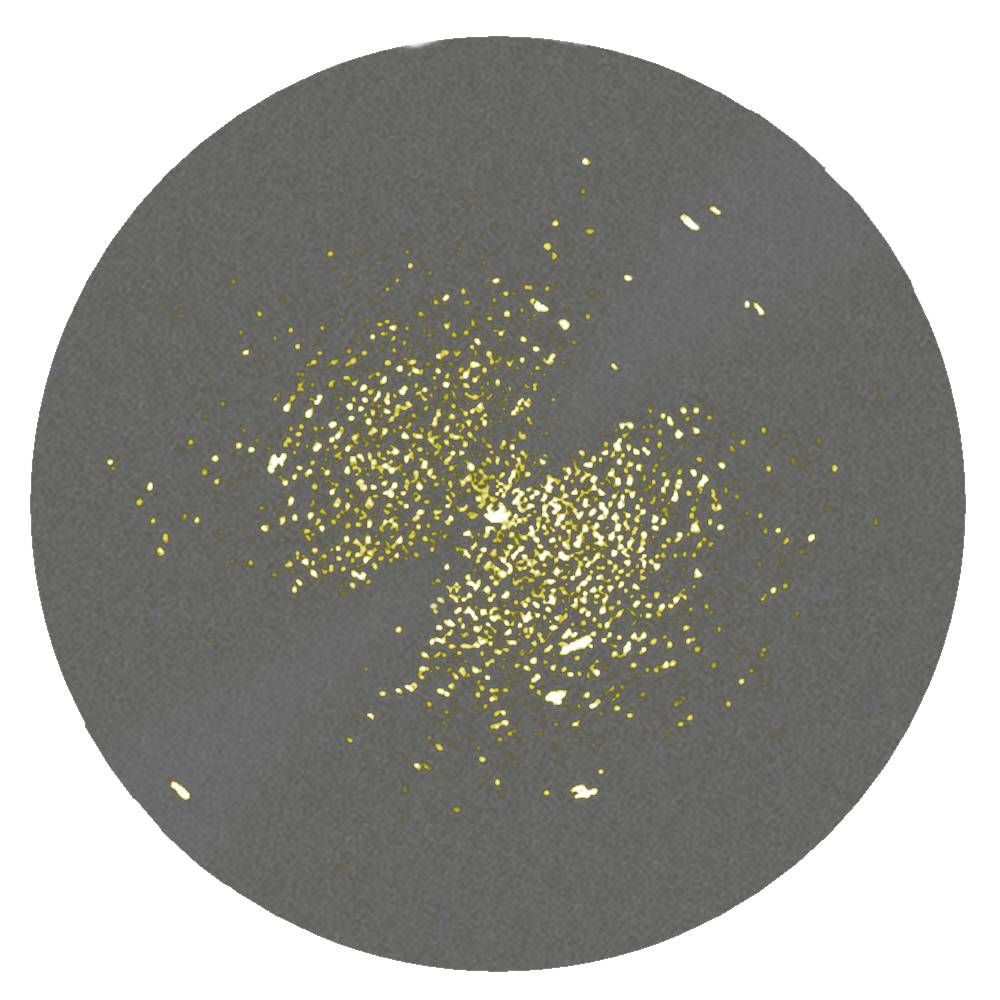
Figure 3: Sea clutter on a PPI display
Sea clutter consists of unwanted echoes reflected from the crests of sea waves. Unlike stationary targets on land, these wave crests do not remain in fixed positions. Wind causes the wave crests to move, and their radial velocity produces a Doppler frequency in the returned echoes. Therefore, suppressing sea clutter with an MTI system is very difficult without also reducing the radar's detection range.
The image shows sea clutter with the wind coming from approximately 310° (northwest) or from the opposite direction. (Unfortunately, a single still image of a PPI display does not reveal whether the Doppler frequency is positive or negative. Only by observing the actual display carefully over a longer period can the drift of the clutter points be detected, allowing the sign of the Doppler frequency to be determined.)
The MTI system clearly “cleans up” the region in which the radial velocity of the waves is very small.
Map of Stationary Targets

Figure 4: A map of stationary targets on paper
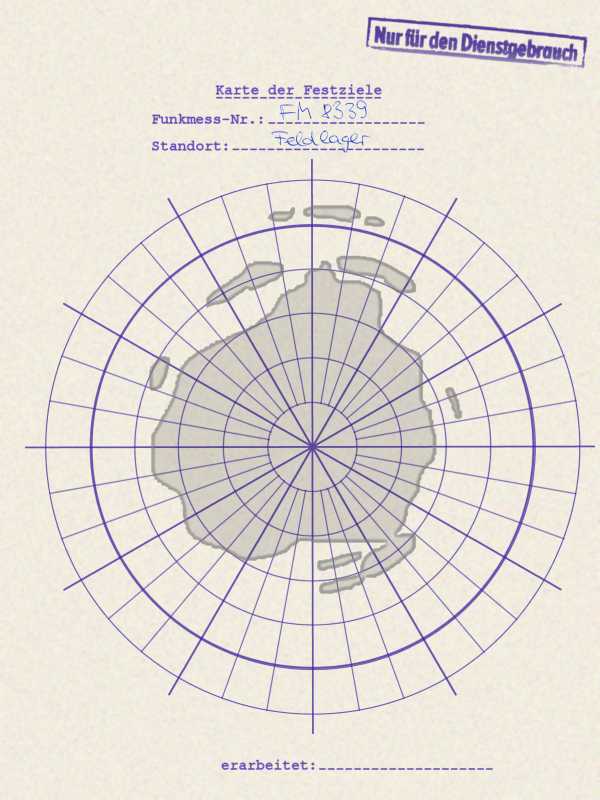
This method dates back to the time when a radar operator still sat in front of a PPI display and manually observed the targets. Today, it is used only when all other clutter suppression equipment has failed. The operator had to memorize a graphical map showing the distribution of clutter around the radar site in order to recognize actual targets even within areas covered by clutter.
Statistical Method Using a Clutter Map
A map of stationary targets can also be stored and managed electronically. For each azimuth angle and each range cell, the typical echo amplitudes are stored. Echoes are primarily displayed when their amplitudes differ significantly from these stored values. With the use of high-performance computers, this method has become a very effective means of suppressing clutter from stationary targets.