Measuring the receiver dynamics
beginning
saturation
minimum
sensitivity
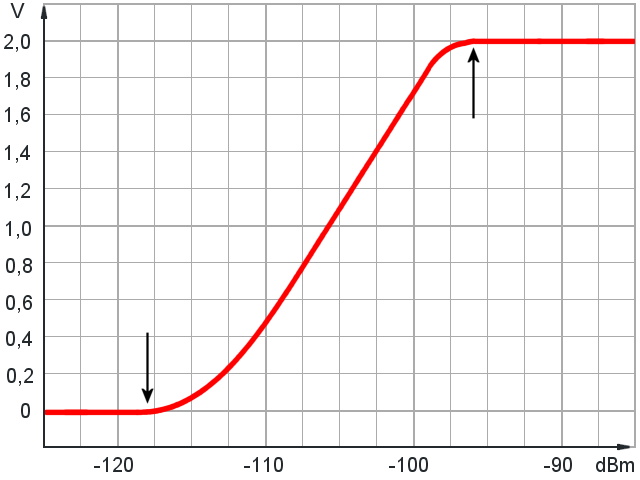
Figure 1: A so-called Receiver-Calibration Curve: The output signal (Y-axis) is a function of the receiver input power (X-axis). The difference between the point of beginning saturation and the point of the minimum sensitivity is the dynamic range of the receiver in Decibel (here: 118 - 83 = 35 dB).

beginning
saturation
minimum
sensitivity
Figure 1: A so-called Receiver-Calibration Curve: The output signal (Y-axis) is a function of the receiver input power (X-axis). The difference between the point of beginning saturation and the point of the minimum sensitivity is the dynamic range of the receiver in Decibel (here: 118 - 83 = 35 dB).
Measuring the receiver dynamics
Measuring the receiver dynamics is of great importance for assessing the performance of the radar. However, the influence of the receiver dynamics on the range of the radar unit is usually underestimated. It must always be remembered that the receiver cannot distinguish between interference and the echo signal. It therefore always receives the noise, the interference (e.g. from fixed targets or the swell), and the echo signal simultaneously. The amplitudes of these signals add up at the receiver input and the receiver quickly reaches the limit. Limitation always means that the upper part of the sum of these signals is cut off from a certain height. This means that the smaller of these input signals is lost. In most cases, this is then the echo signal.
The same test composition is used for measuring the receiver dynamics and for measuring receiver sensitivity.

attenuator
0 … −120 dB
coupler
−31.5dB
Figure 2: Measurement setup for the receiver dynamics, losses in the directional coupler, the connectors and the cable can be neglected here.

attenuator
0 … −120 dB
coupler
−31.5dB
Figure 2: Measurement setup for the receiver dynamics, losses in the directional coupler, the connectors and the cable can be neglected here.
attenuator
0 … −120 dB
coupler
−31.5dB
Figure 2: Measurement setup for the receiver dynamics, losses in the directional coupler, the connectors and the cable can be neglected here. (interactive picture)
With this measurement setup, several measurements (at least two) with different input powers must be performed to obtain a sensitivity curve as shown in Figure 1. For each measurement, the set attenuation value (dB) of the attenuator is plotted on the X-axis. The corresponding amplitude of the test signal in volts is plotted on the Y-axis. The point of intersection of both values results in a measurement point in the diagram. A large number of such measurement points then result in the Receiver Calibration Curve. The dynamic behavior of the receiver can be read from this curve.
If the same test setup is used for all measurements, the losses due to connectors and measuring cables do not have such a great influence here. The receiver dynamic range is the difference in decibels between the lower and the upper crook of the curve. Whether this whole diagram is shifted by about 6 dB to the left or right is irrelevant for the result. Only if changes are made in the test setup, for example, because additional attenuators with a fixed value are inserted, then these corrections must be made in the same way as for the sensitivity measurement.
Of two radar receivers with the same sensitivity, the better one is this one with a flatter curve, i.e. a larger dynamic range. However, the radar technician at the radar unit does not influence this receiver dynamics. Settings that change these receiver dynamics can only be made under laboratory conditions. This is usually only possible directly by the manufacturer or in specialized workshops.
There are also sets of measuring instruments which perform this receiver calibration curve automatically and computer-aided. Although this is much faster, it has the same result. Above all, the same mistakes can be made during the measurement setup as during manual measurement. Since the transmitter is switched off, no automatic frequency adjustment works. If the temperature in the receiver changes, its frequency response also changes. A large deal of time should, therefore, be allowed for this measurement and the working frequency at the signal generator should be adjusted to the slightly changed resonance frequency of the receiver (or vice versa).